Myth #5: The Grid Plan Leveled Manhattan
By Jason Barr with Gerard Koeppel

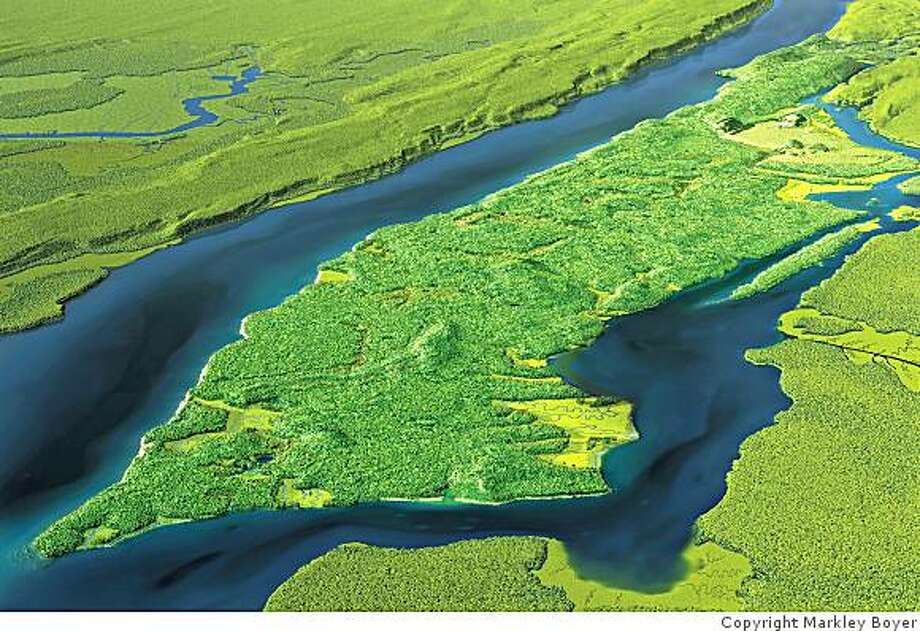
In 1609, when Henry Hudson sailed up the river that now bears his name, he saw an island forest covered in oak, pine and tulip trees. Two centuries later, in 1811, when the grid plan was enacted, most of Manhattan was still undeveloped. In fact, the footprint of the city itself encompassed only 1.3 square miles at the lower tip. The rest was quite sleepy - farms, country estates, and pockets of unspoiled nature.
A few rural villages, such as Manhattanville, were also scattered throughout. A military map of Harlem Heights with a landscape vignette, drawn in 1814, depicts a bucolic landscape as if taken from a Washington Irving story. A curious explorer would have found Manhattan’s topography an undulating series of hills, valleys, streams, and wetlands.
When the grid plan was being conceived, it was a visionary notion that someday nearly the entire island would be transformed into a global metropolis. There were no automobiles or railroads, and steamboats were still a strange curiosity. The average person was dependent on her own two feet or a horse for transportation. Visiting a friend in Harlem Heights from the city was a three-hour journey.

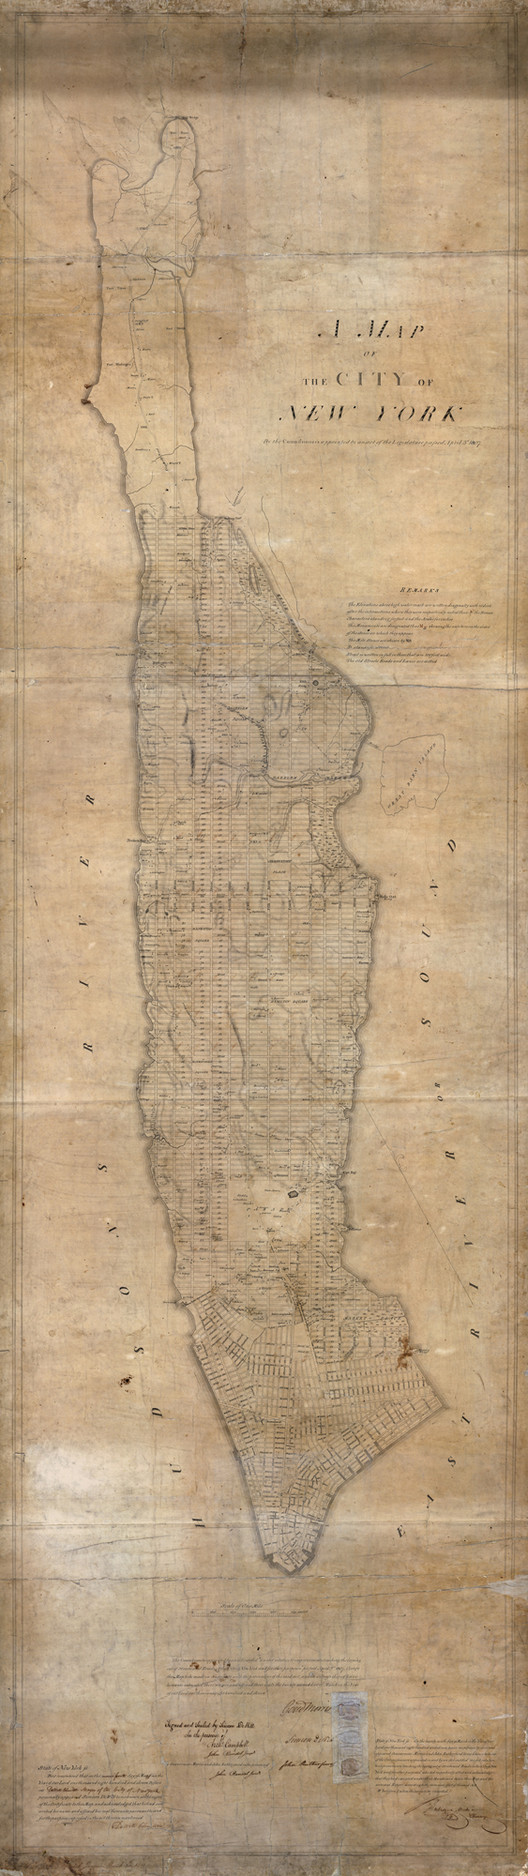
As discussed in a previous post, the Commissioners specified very little in the plan, only presenting a map of streets and blocks. Looking at the two-dimensional map created by John Randel, Jr. (right) gives the impression that from the tabula rasa of rural New York urban order was created. But that was not true at all.
The plan said nothing about street grades or how the grid and topography were to work together… or not. Rather, as the mandated streets started to appear, road slopes would be determined piecemeal, based on the need to facilitate transportation by keeping elevation changes minimal. As streets were opened, if a landowner found he was above or below the grade, he was forced to go down or build up, often at considerable cost, to match his lot with the street. In the 27 years from 1830 to 1856, the nearly 200 openings of road segments or public squares placed a heavy burden on property owners, who were also assessed to pay for the new streets themselves (but compensated for the loss of their lands taken for the streets).
A drawing of newly formed Second Avenue at newly formed 42nd Street in 1861 illustrates this transformation (see below). The avenue itself appears as a kind of urban gorge, enclosed by steep hills of bedrock. On the east side, a lone, elegant house with porch and balcony is perched some 20 feet atop an extrusion of schist. A temporary wooden staircase strapped to the rock allows access to the home. The owner was clearly a holdout, unwilling or unhurried to level his property.

Sketch of Second Avenue and 42nd Street in David Valentine’s 1861 edition of the Manual of the Corporation of the City of New York.
The image has helped fuel the conventional wisdom that the grid plan was a great leveler, tearing the city down to a uniform, flat topography. But to what extent is this true? We can say for sure that the ecology changed. The oaks, pines, and tulip trees have been replaced by a brick and steel forest. All wetlands and streams were buried or drained. Wild animals, from beaver to mountain lion, are long departed.

Manhattan elevation (excluding current-day parks) for each block that existed 1609. Note that the underlying Manhattan street map is of 1900. Sources: Image by Jason Barr. Elevation data courtesy of Eric Sanderson, the Mannahatta Project, Wildlife Conservation Society. Also note that Sanderson relied heavily on the British Headquarters Map of 1789 for digitizing the elevation.
A 3D image (left) gives a sense of the original elevation that existed in Hudson’s day. Lower Manhattan’s elevation was relatively close to the sea level (the gray areas were wetlands). The elevation did not substantially change until one went north of today’s 34th Street. Then there was much more variation, with a rocky and hilly area running to Washington Heights on the west side, and to about Third Avenue and 105th Street on the east side. East Harlem and the northern tip were flat and low.
But how much of this elevation was changed? For this, we can look at a map (below) which shows the changes in elevation between 1609 and 2012 for each block on Manhattan. The red regions show where the land was raised more than ten feet. The blue areas are where the land was lowered more than 10 feet. The figure shows that in actuality the land changes were not as dramatic as we have come to believe.

Average changes in elevation between 1609 and 2012 (excluding the current-day parks). Source: Map by Jason Barr; 1609 elevation data is courtesy of Eric Sanderson, the Mannahatta Project, Wildlife Conservation Society.
The map suggests that rather than a great leveling, the island was subject to a great smoothing. In fact, about two-thirds of all blocks had changes of less than 10 feet, and 40 percent of the blocks had average elevation changes of less than 5 feet. The modal change was to add between 0 and 10 feet; much of this was also due to infill along the riverbanks. Nearly as much of the island was “brought up” as it was “brought down.” Valleys needed to be filled in, while the hills were lowered. The average change across all blocks, in fact, was increase of elevation of 1.7 feet.
This is also confirmed by a statistical analysis, which looks at what variables drove the average change in the elevation of each block. These control variables included the starting elevation in 1609, whether there was a stream on the block, or whether the area was formerly wetlands. In short, higher elevation blocks were reduced, on average, by 1.5 foot per 10 feet rise in elevation. If an area was a wetland, its elevation was increased, on average, by about 3.4 feet.
Despite the images of the houses perched on rocky hills surrounded by the newly created streets several feet below, the data suggest that this was not the norm across Manhattan. Today the general topography remains the same as it did in 1609; the Battery is prone to flooding from storm surges and Bennet Park, at 183rd Street, is still the island’s highest point, but the transition from south to north is much more evenly gradual.
Jason M. Barr is a Professor of Economics at Rutgers University-Newark, and the author most recently of Building the Skyline: The Birth and Growth of Manhattan’s Skyscrapers. Gerard Koeppel is the author of City on a Grid: How New York Became New York, Water for Gotham: A History, and Bond of Union: Building the Erie Canal and the American Empire.